I Review My Claude Code Usage Every Week. Here's What I Look At
Claude Code doesn't tell you where your tokens, money, or time went. Here's the weekly review habit I built with Agento, a free, open-source local dashboard for your Claude Code sessions.
On this page ▾
I have a small ritual now. Once a week, usually Friday, I open a browser tab and spend ten minutes looking at what my AI coding actually cost me: in money, in tokens, and in my own time.
That habit has changed how I work more than any prompt trick I’ve picked up.
It took me a while to build it, because Claude Code gives you almost nothing to work with. It’s a terminal tool. You run it, it does excellent work, the session ends, and the whole thing evaporates. /cost tells you about the session you’re in right now. It cannot tell you that the model you switched to last month is quietly responsible for most of your bill, or that you re-pay for the same context five times a day because of how you start sessions, or that your tool error rate doubled after you installed a new skill.
All of that information does exist. Claude Code writes every session to a JSONL transcript under ~/.claude. Nobody reads those files, because they’re enormous and unreadable by design.
So I started using Agento, a free, open-source tool that reads them for you and turns them into a dashboard. It runs entirely on my laptop. One Go binary, a local SQLite cache, no account, no API key, nothing leaving the machine. I start it with agento web, it opens on port 8990, and it picks up every Claude Code session I’ve ever run.
Here is what I actually check, and what each thing has taught me.
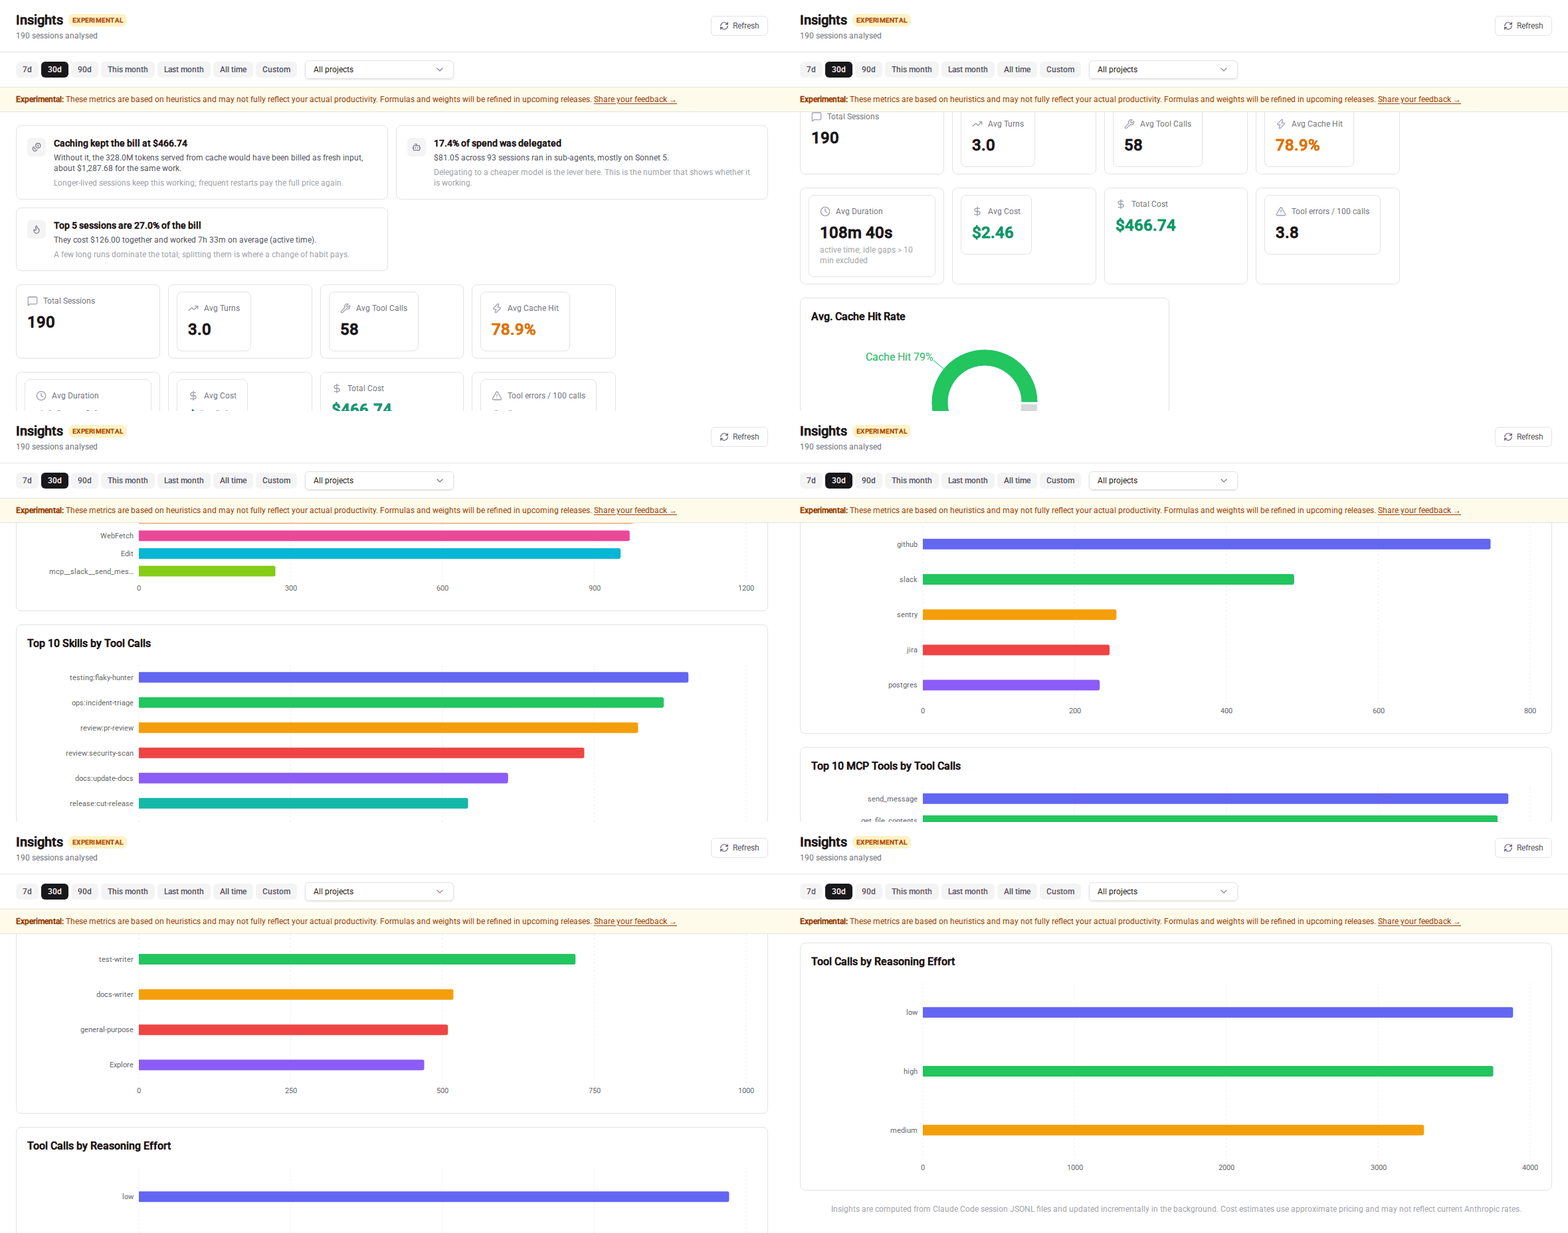 The Insights page: plain-English cards at the top, then the metrics they came from
A note on the screenshots below: they are from a generated sample dataset, not my own machine. My real numbers are none of the internet’s business, and yours will look different anyway. What matters is which questions the dashboard answers.
1. Where the money goes, and why token charts lie
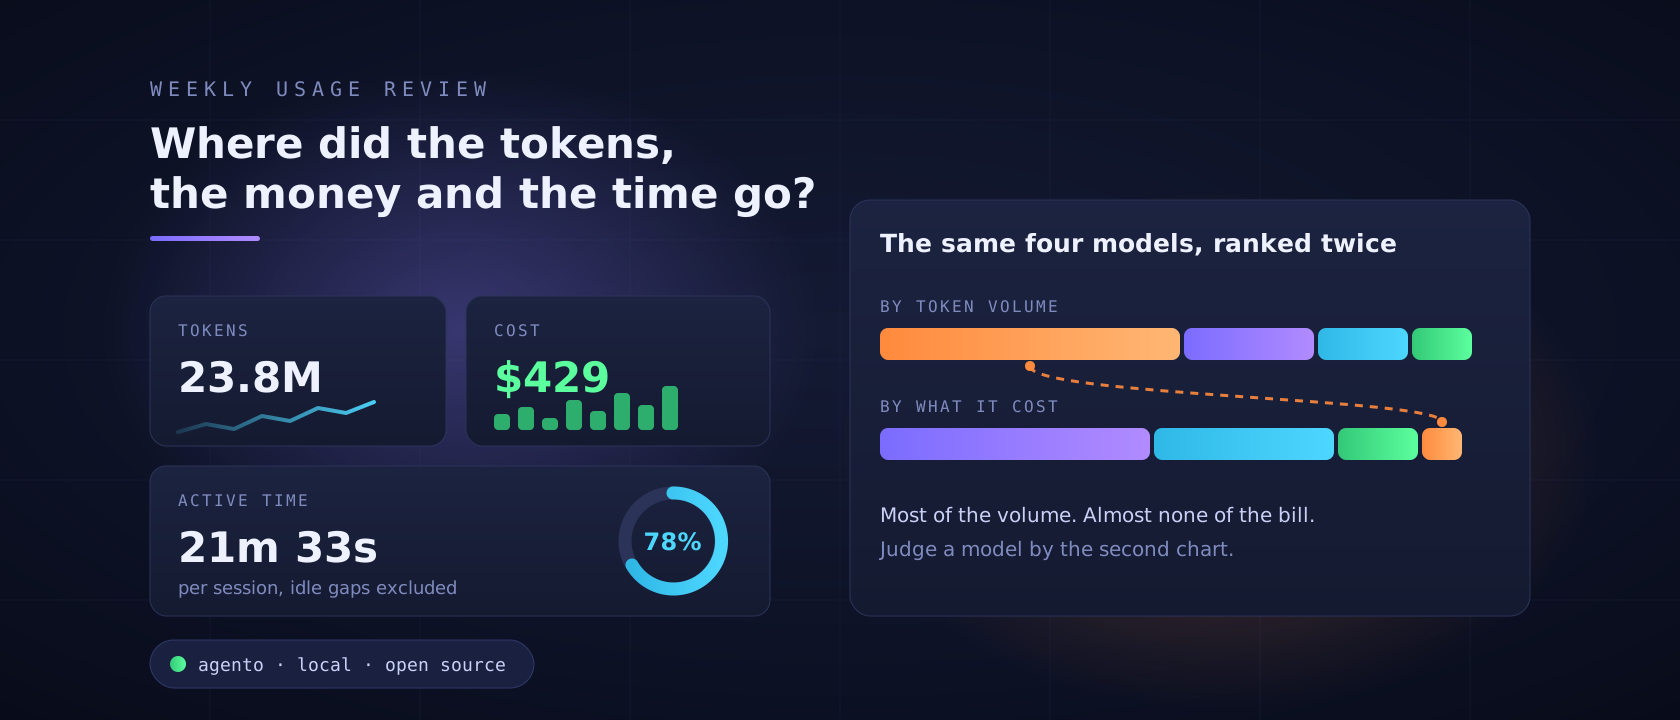
The first thing I look at is cost broken down by model, and next to it, tokens broken down by model. They almost never tell the same story, and that gap is the single most useful thing I’ve learned.
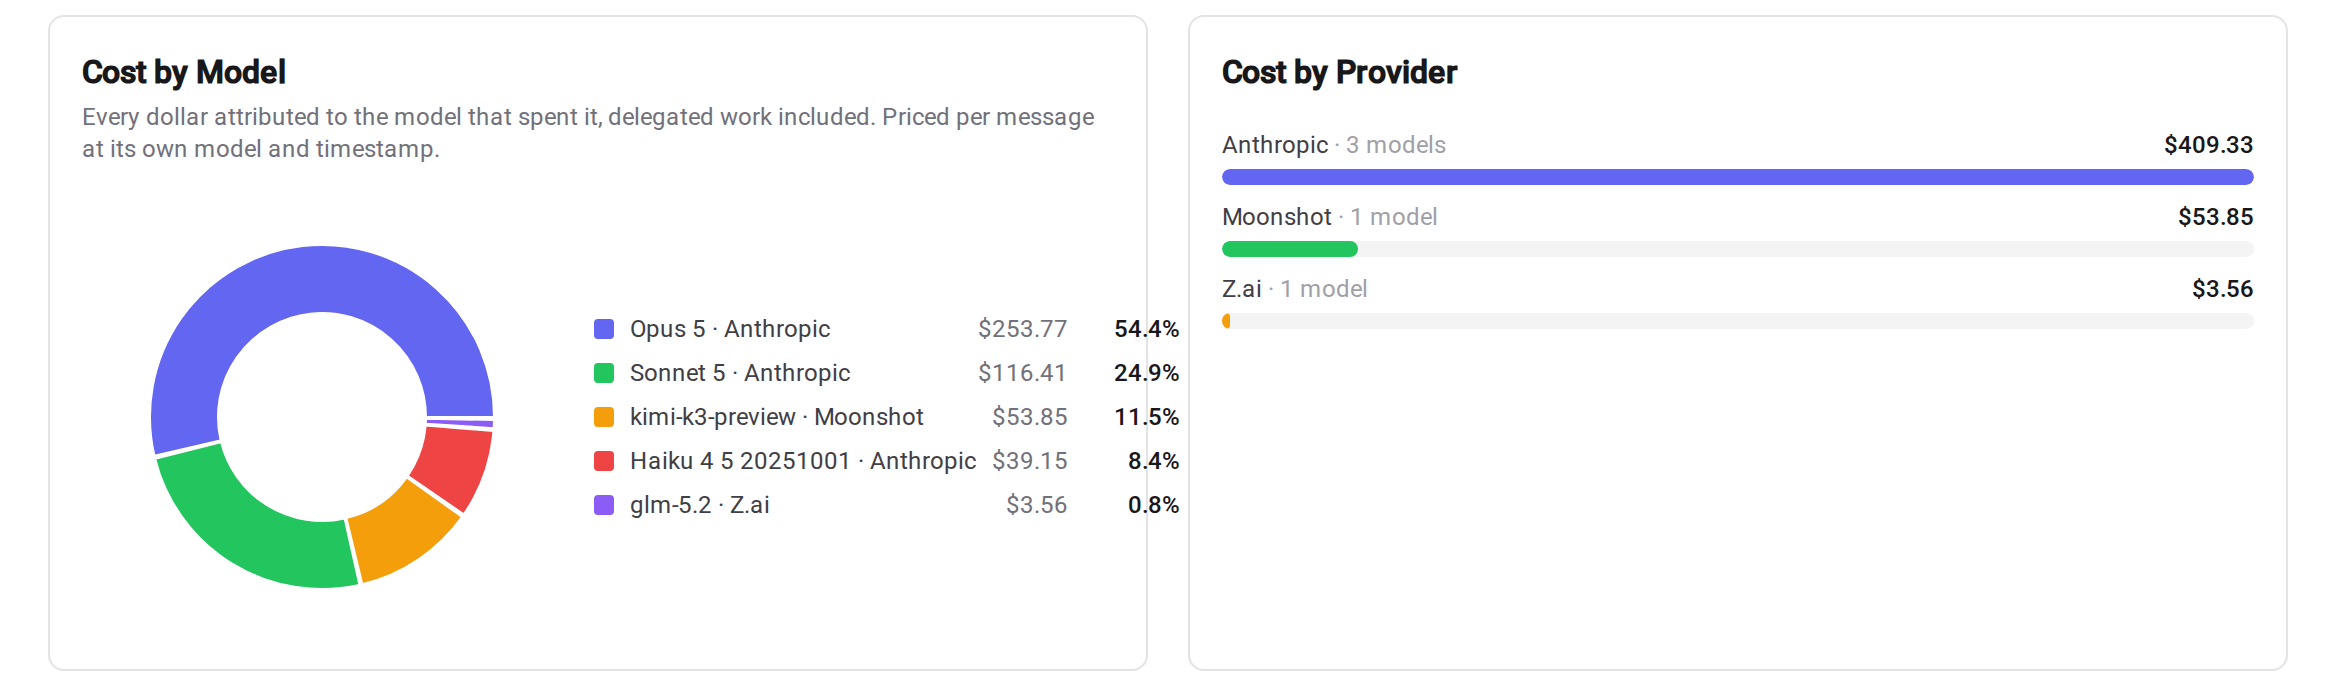 Cost attributed to the model that spent it, including work done by sub-agents
A cheap, high-volume model can eat an enormous share of your token count and still be a rounding error on your bill. Meanwhile a premium model you reach for a few times a day can be most of what you actually pay. If you judge your setup by the token chart, which is the chart everyone instinctively reads, you will optimize exactly the wrong thing.
There’s a second reason token counts mislead. Most of what flows through a Claude Code session isn’t fresh input at all; it’s cached context being re-read. Cache reads bill at a fraction of input, and cache writes bill above it.
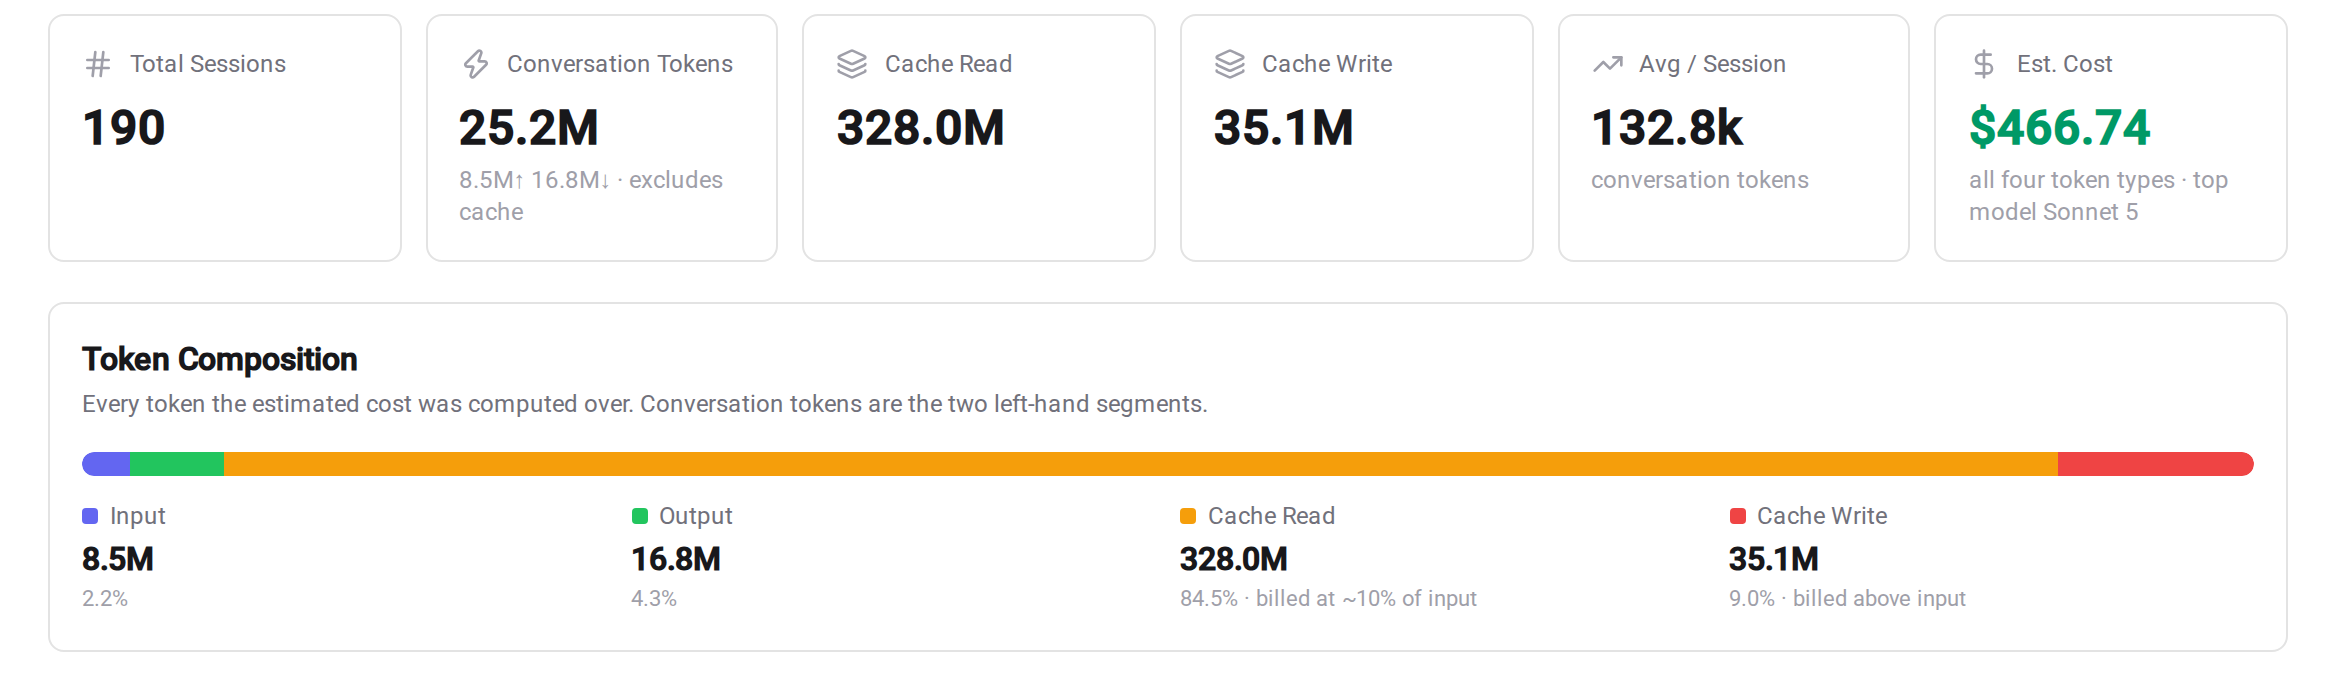 Four token types, priced separately: input, output, cache read and cache write
Agento splits all four apart and prices each one per message, at the model and the date that message was actually sent. So the number at the top is a reconstruction rather than tokens multiplied by one rate. It also handles non-Anthropic backends. The pricing catalog is editable and effective-dated, and a model it has no published rate for shows up as unknown instead of being quietly priced as something else.
The practical rule I ended up with: read the cost chart, not the token chart. I keep both open side by side precisely so I don’t forget.
2. Caching, which is the biggest lever nobody talks about
The dashboard leads with a card telling me what prompt caching saved over the period: what the same work would have cost if every cached token had been billed as fresh input. It’s an estimate, and it says so, but the order of magnitude is not subtle. Caching is not a nice-to-have; it’s most of the economics.
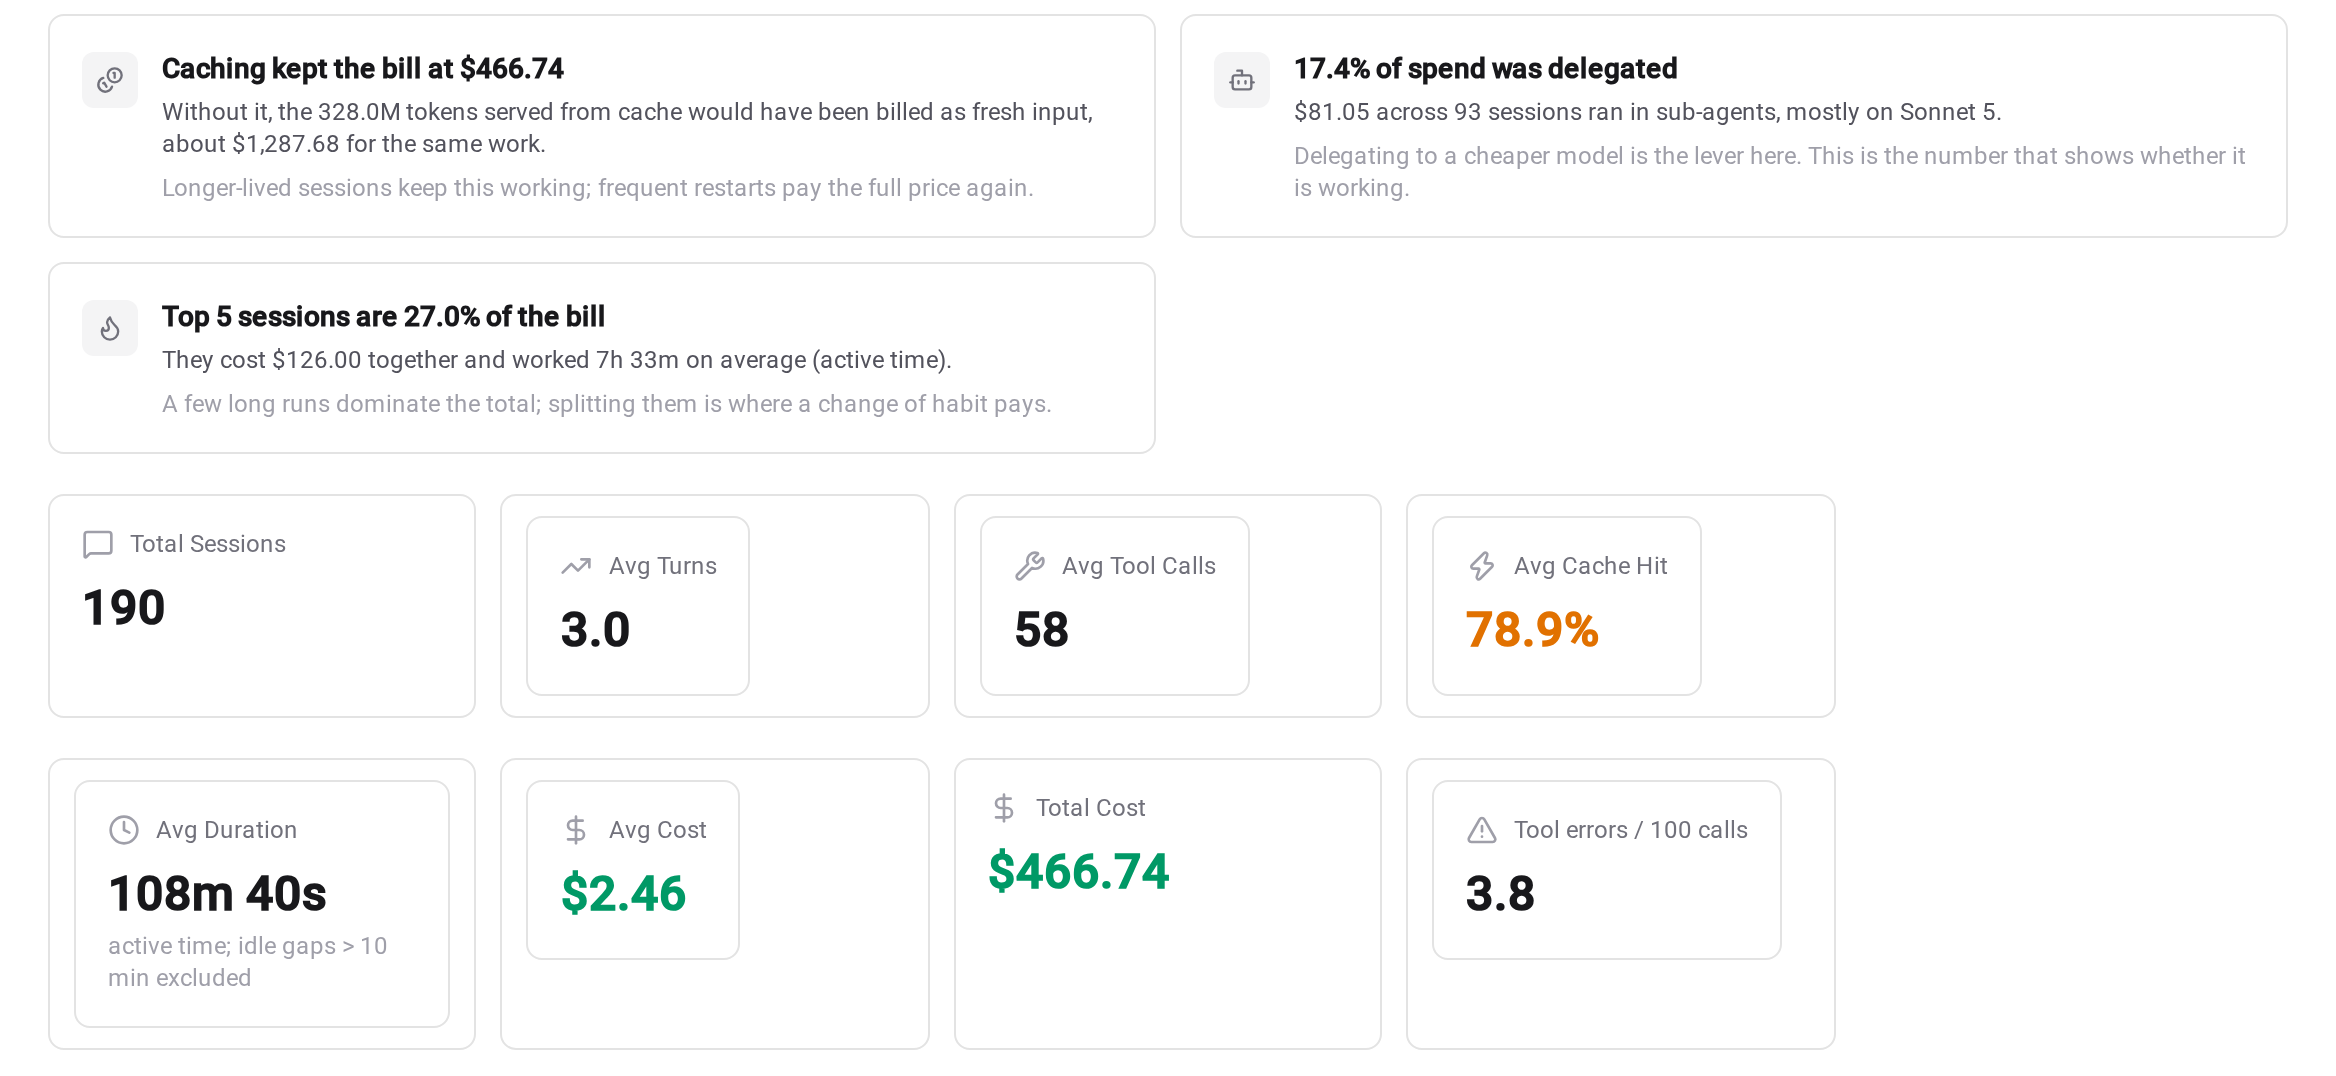 Cards that name the lever, not just the number: caching, delegation, and the sessions that dominate the bill
Which means the habits that break caching are expensive habits. Killing a session and starting fresh because it feels cleaner. Restarting after every small change. Splitting one task across five short sessions instead of one long one. Every restart re-pays for context you already paid for.
There’s also a per-model view of this. Some backends barely serve anything from cache, so their context is re-billed as fresh input on every turn. That’s a model-selection consideration with nothing to do with the model’s headline price, and I’d never have noticed it without seeing cache hit rate charted per model over time.
3. Is my delegation actually saving anything?
I lean heavily on sub-agents. Delegation is supposed to be a cost lever: the orchestrating session runs on a strong model, and the grunt work of searching, reading and summarizing goes to something cheaper.
The question is whether that’s what actually happens, and the honest answer was “not always.” Sub-agents inherit the parent’s model unless you say otherwise, so it’s easy to believe you’ve routed work to a cheap model while every delegated run quietly uses the expensive one.
Agento tracks delegated work separately, and (this is the part I care about) credits a sub-agent’s tokens and cost to the model the sub-agent ran on, not the model that delegated. That’s the only way the chart can answer the question you’re asking it. It shows what share of spend was delegated and which model absorbed it, and that’s the number I watch when I’m tuning agent definitions.
4. The handful of runs that dominate everything
Every period, a small number of long autonomous sessions account for a disproportionate slice of the total. Not a surprise in hindsight. Cost compounds with context length, so one eight-hour run isn’t eight times a one-hour run, it’s considerably worse.
Seeing that ranked, week after week, changed how I scope work. I now split large autonomous runs into smaller, independently-scoped ones far more aggressively than I used to. Same output, meaningfully lower cost, and the failures are easier to diagnose because each run has one job.
5. Am I getting more efficient, or just busier?
This is the part that’s genuinely hard to answer on gut feel, and it’s why the Insights page is where I spend the most time. It’s marked experimental, since the formulas are heuristics and the app says so plainly, but the trends are informative even when the absolute numbers are debatable. Everything is shown against the equivalent preceding period, so I read direction rather than magnitude.
The metrics I actually use:
- Turns per session. How many times I had to step in. Fewer turns for the same work means my prompts and agent definitions are carrying more weight.
- Steps per turn, and longest autonomous chain. How far Claude gets before it needs me. This is the number that says whether I’m supervising or babysitting.
- Tool calls per session, and tool errors per 100 calls. The error rate is my early-warning signal. When it jumps, it’s almost never the model. It’s a skill, a stale instruction, or a badly configured tool.
- Active duration. Not wall-clock. Sessions are resumable, so one you return to on Thursday would otherwise look like a three-day session and wreck every average. Active duration counts only time where something was actually happening, ignoring idle gaps beyond a threshold you set yourself.
- My own response time. How long Claude waited on me, charted next to how long I waited on Claude. That one is humbling.
Underneath sit breakdowns by tool, skill, plugin, MCP server and sub-agent.
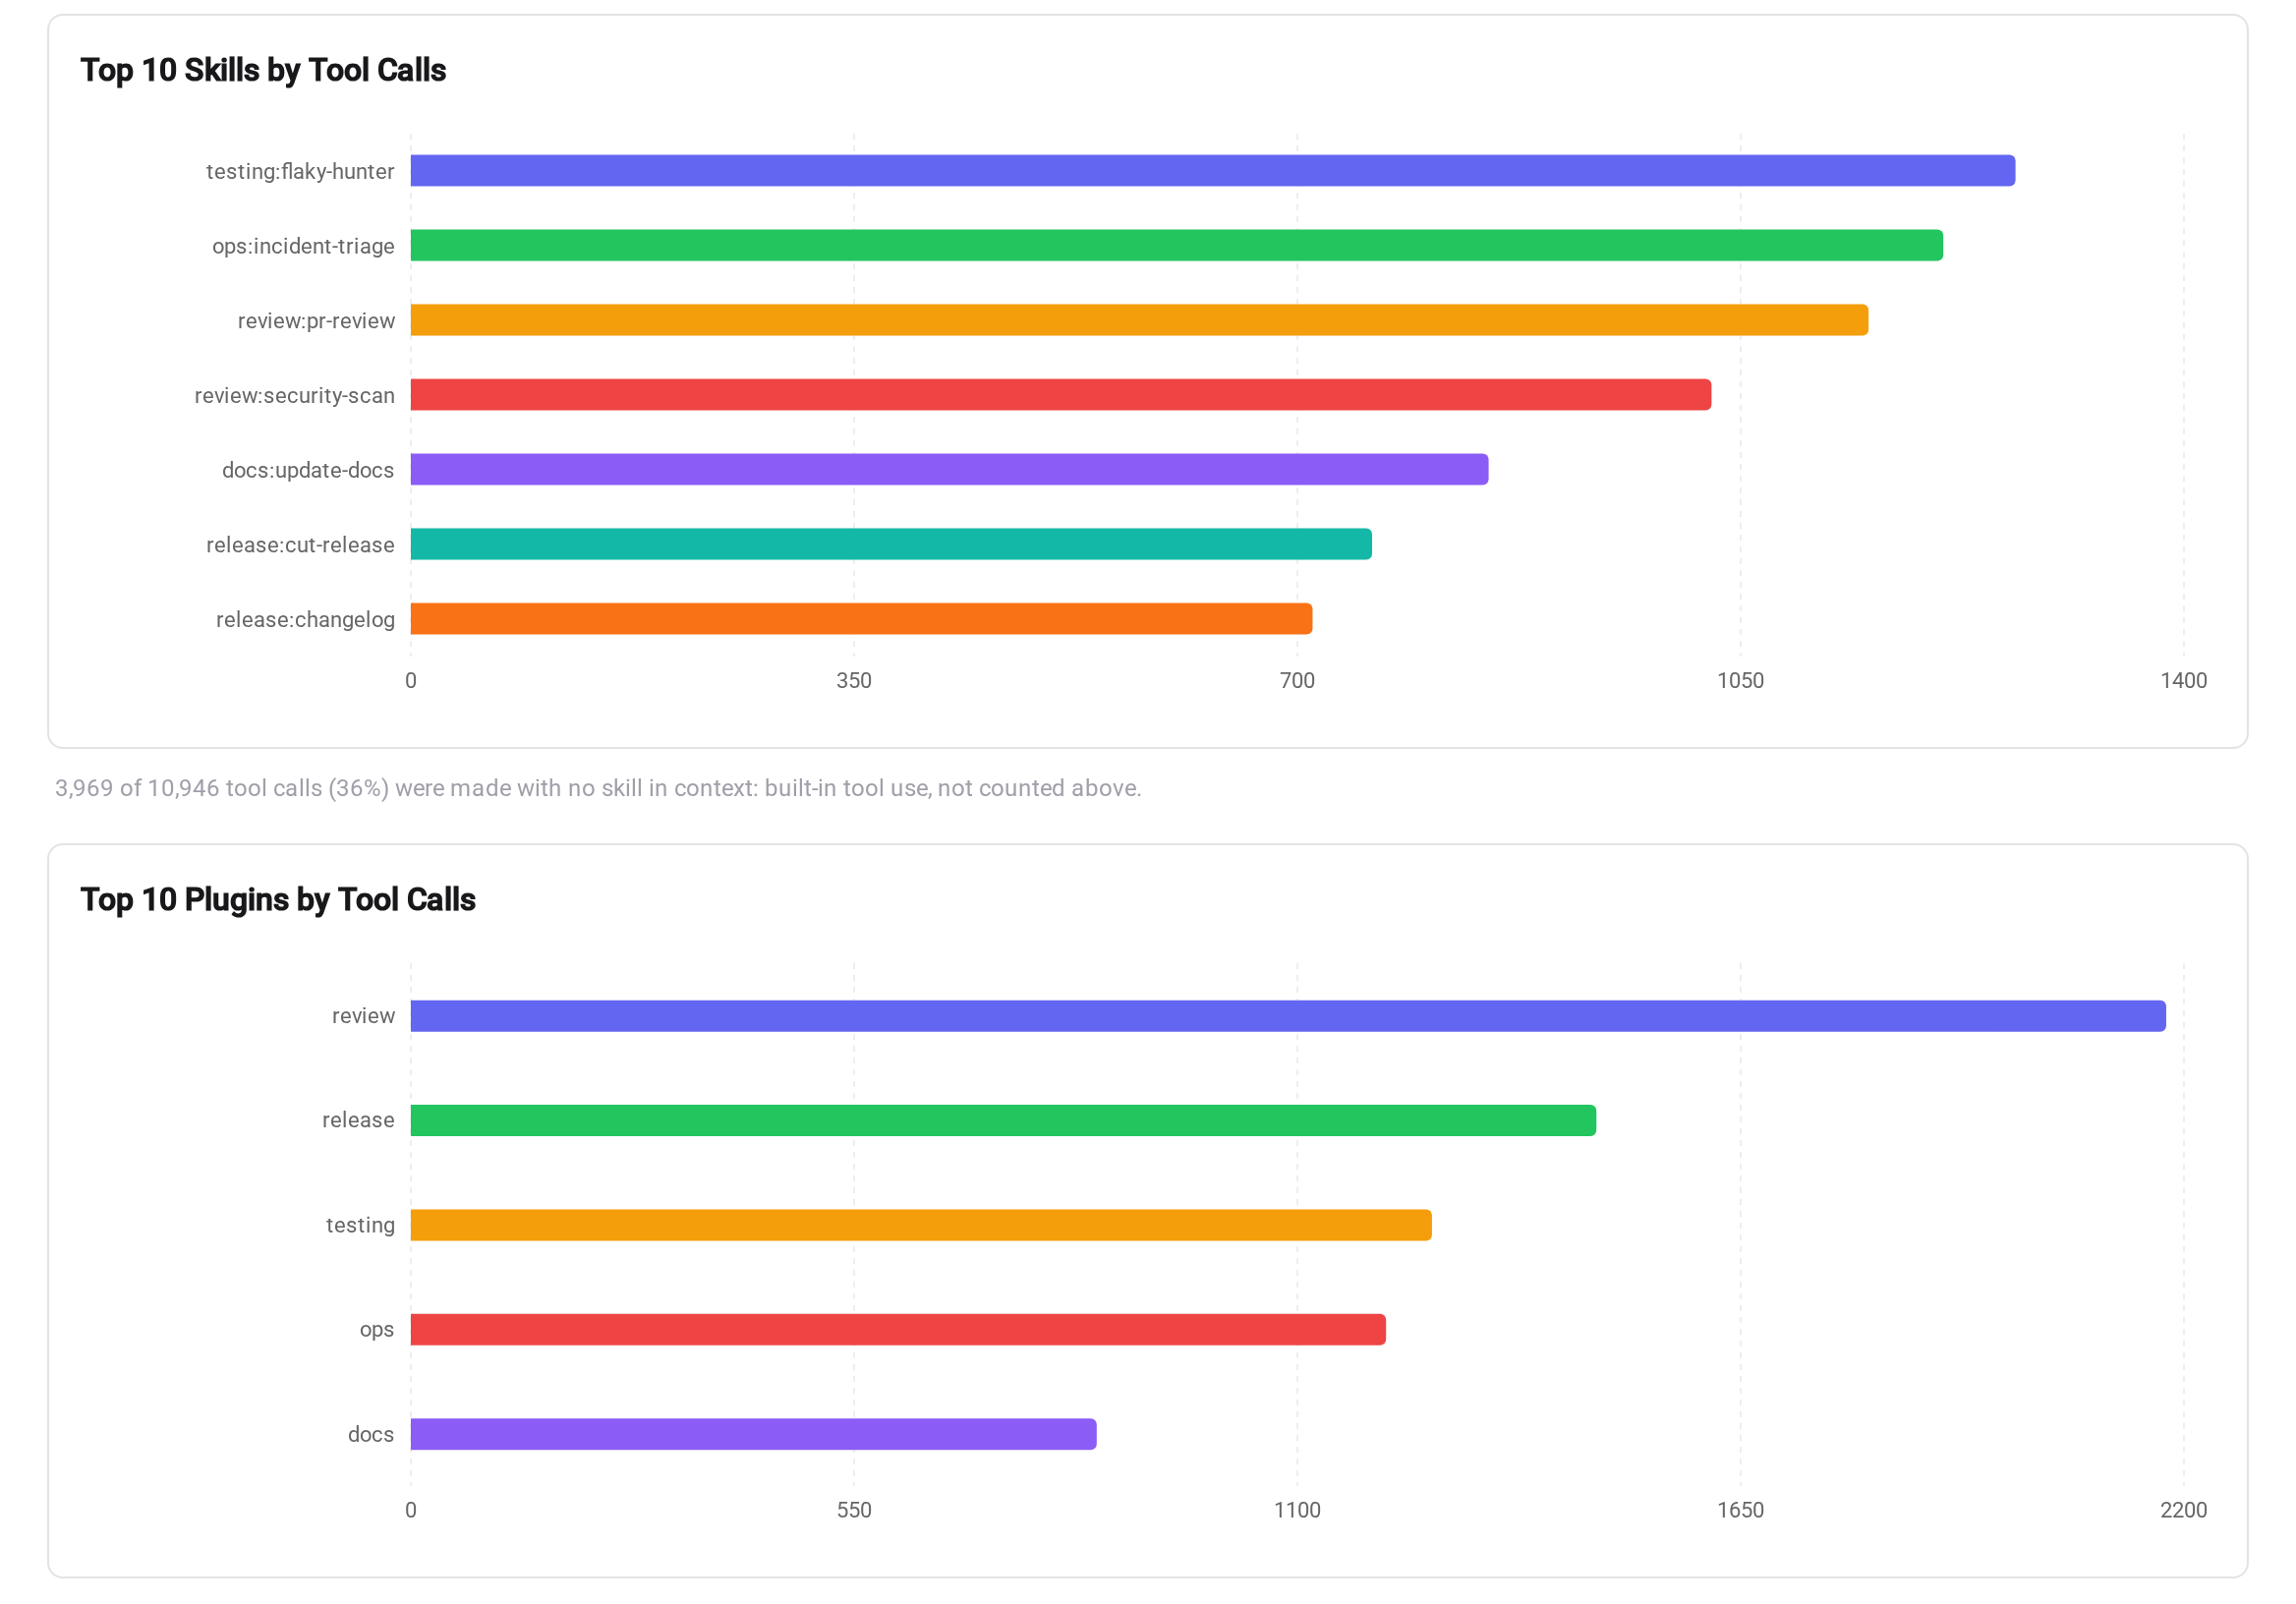 Tool calls attributed to the skill and plugin responsible, with the same view for MCP servers, MCP tools and sub-agents
That’s how I found out which of my skills were burning the most tool calls, which led directly to rewriting two of them and deleting a third.
6. When something looks wrong, drilling into one session
The dashboards tell me that something changed. To find out why, I open the session itself.
The session list is searchable and filterable by project, model, date and cost, and every row shows the branch, the permission mode, and any pull requests that session touched.
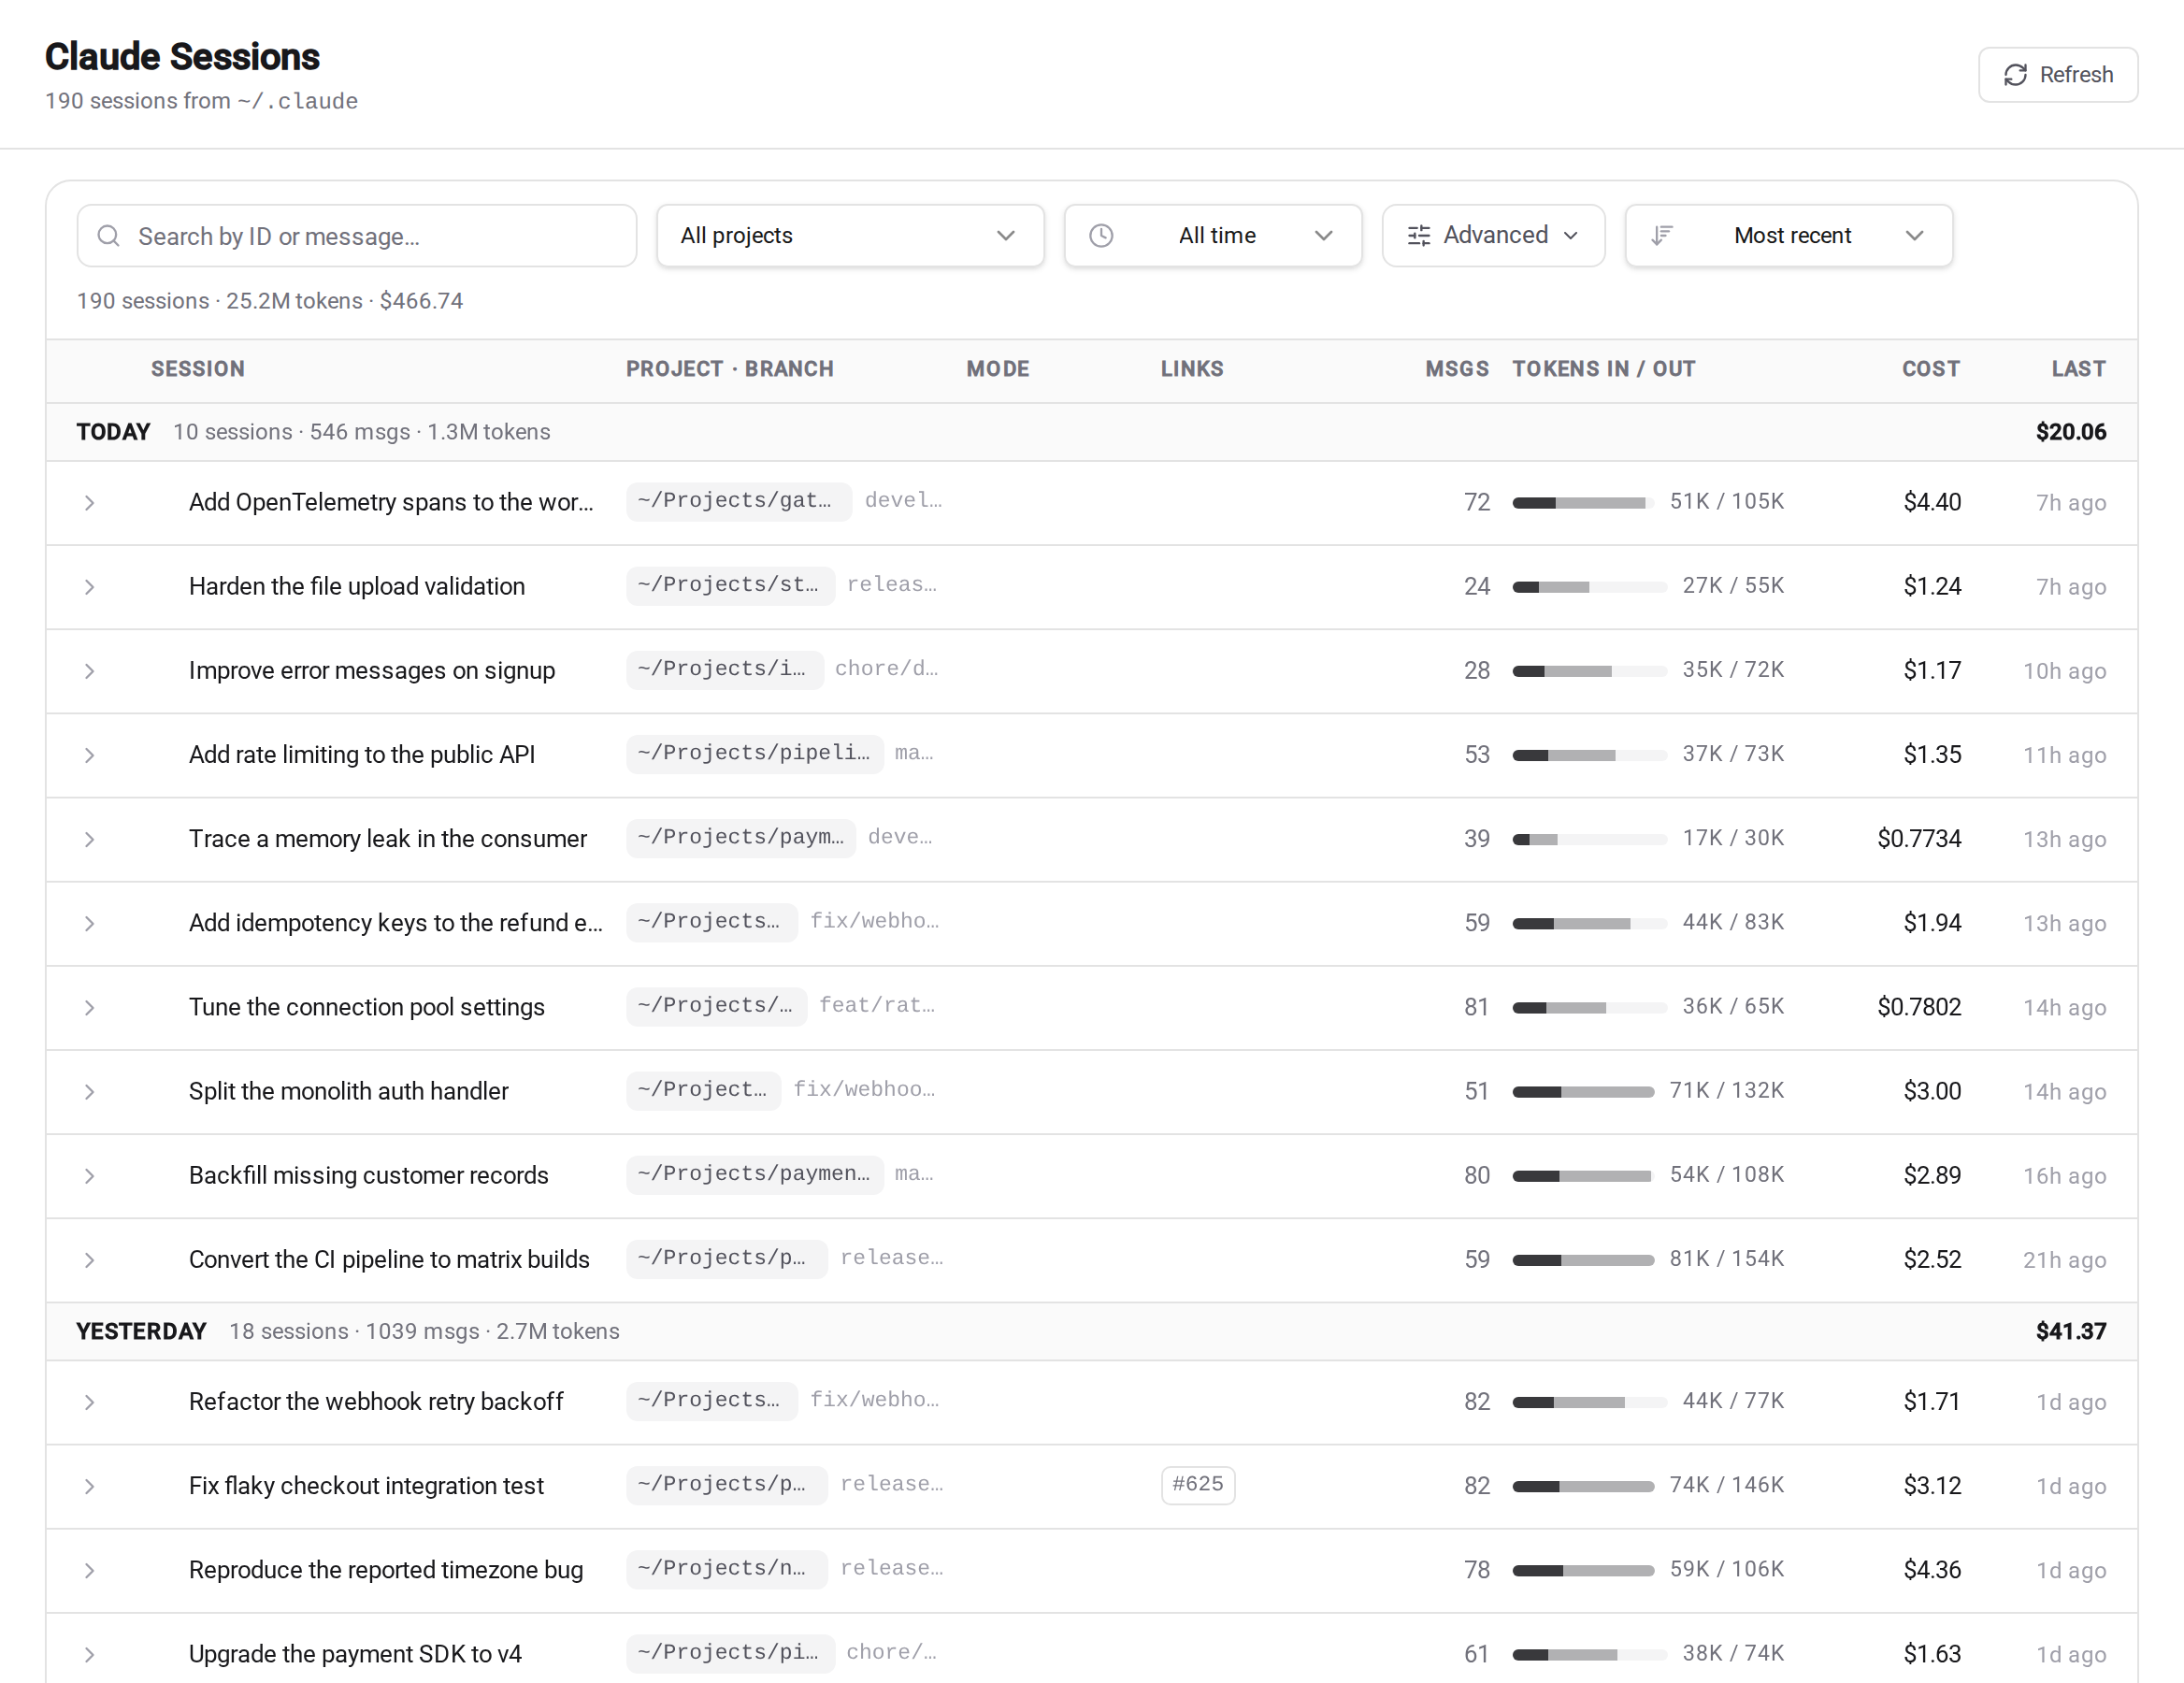 The session list: filterable, sortable, grouped by day, with cost per session and per day
Opening one gives me the full transcript plus that session’s own metrics. And there’s a journey view: a step-by-step timeline of every message, tool call and result in order, with each sub-agent’s steps nested underneath the delegation that spawned it.
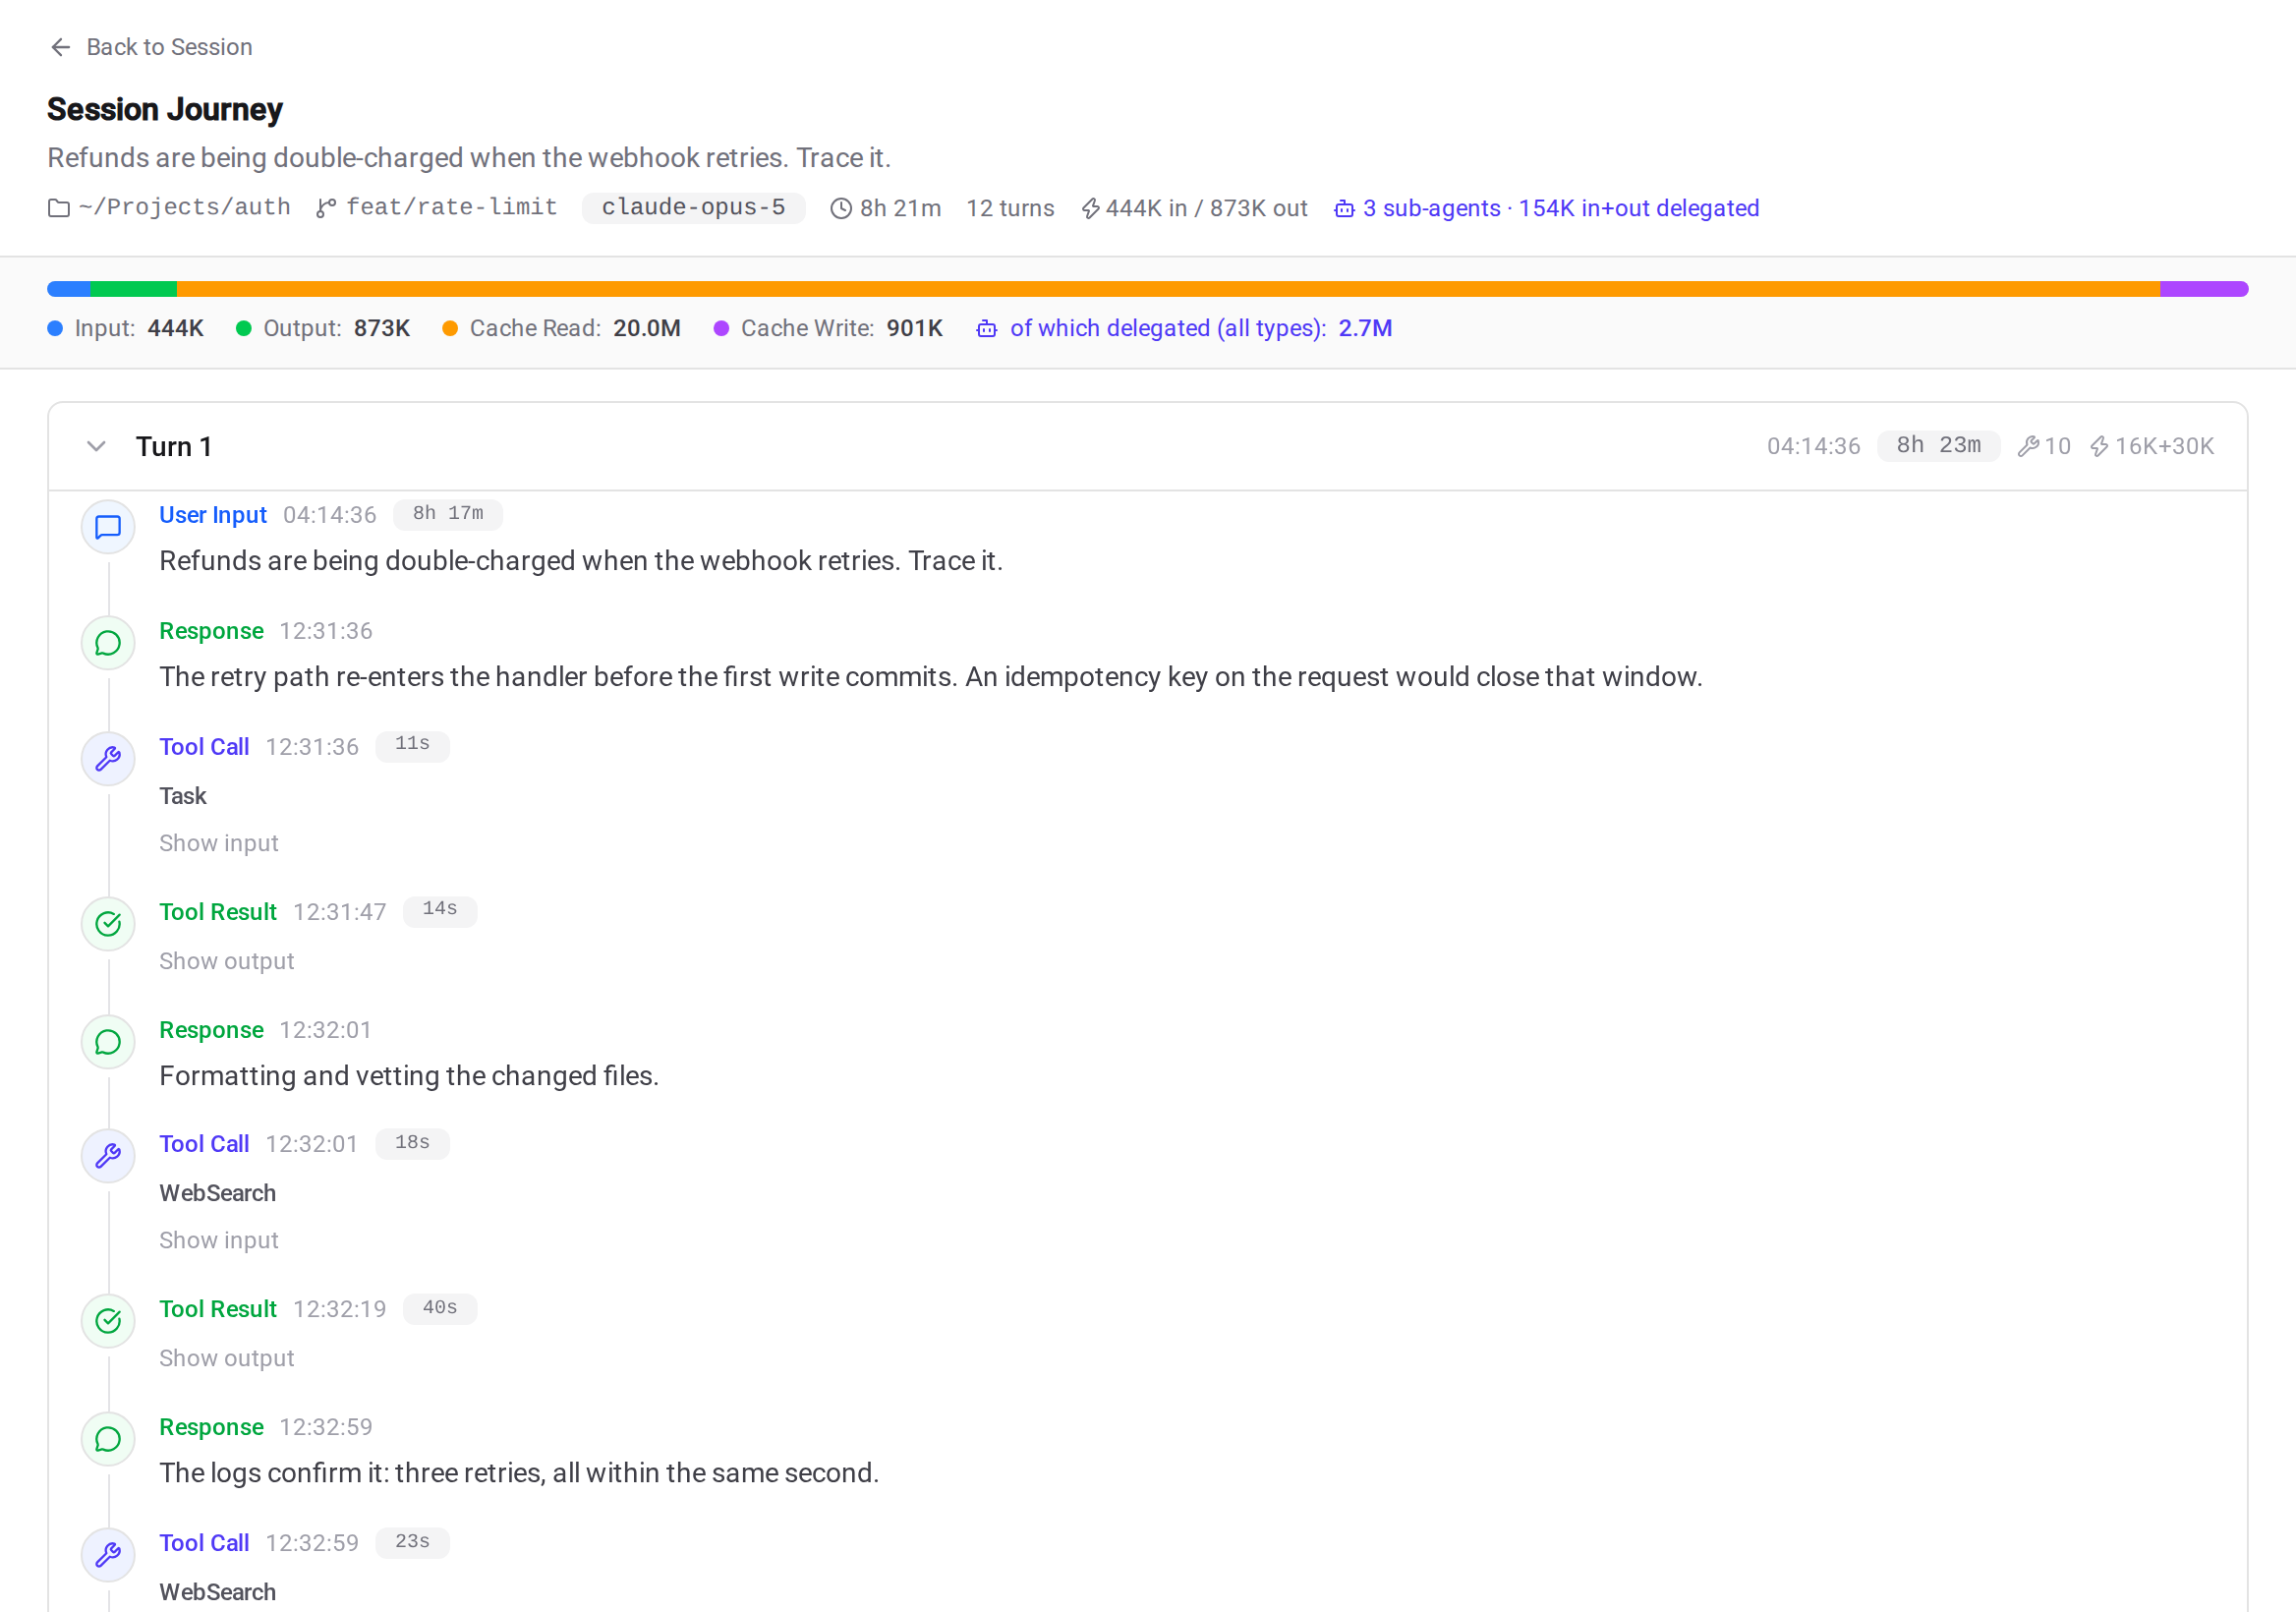 The journey view: every turn, tool call and result in order, with delegated work nested underneath
That nesting is what makes a long autonomous run legible. When a four-hour session costs three times what a similar one did, the journey view usually shows me exactly which delegated branch went sideways, in about a minute.
7. When I actually work
One chart I didn’t expect to care about: the day-by-hour activity heatmap, and the hourly histogram next to it.
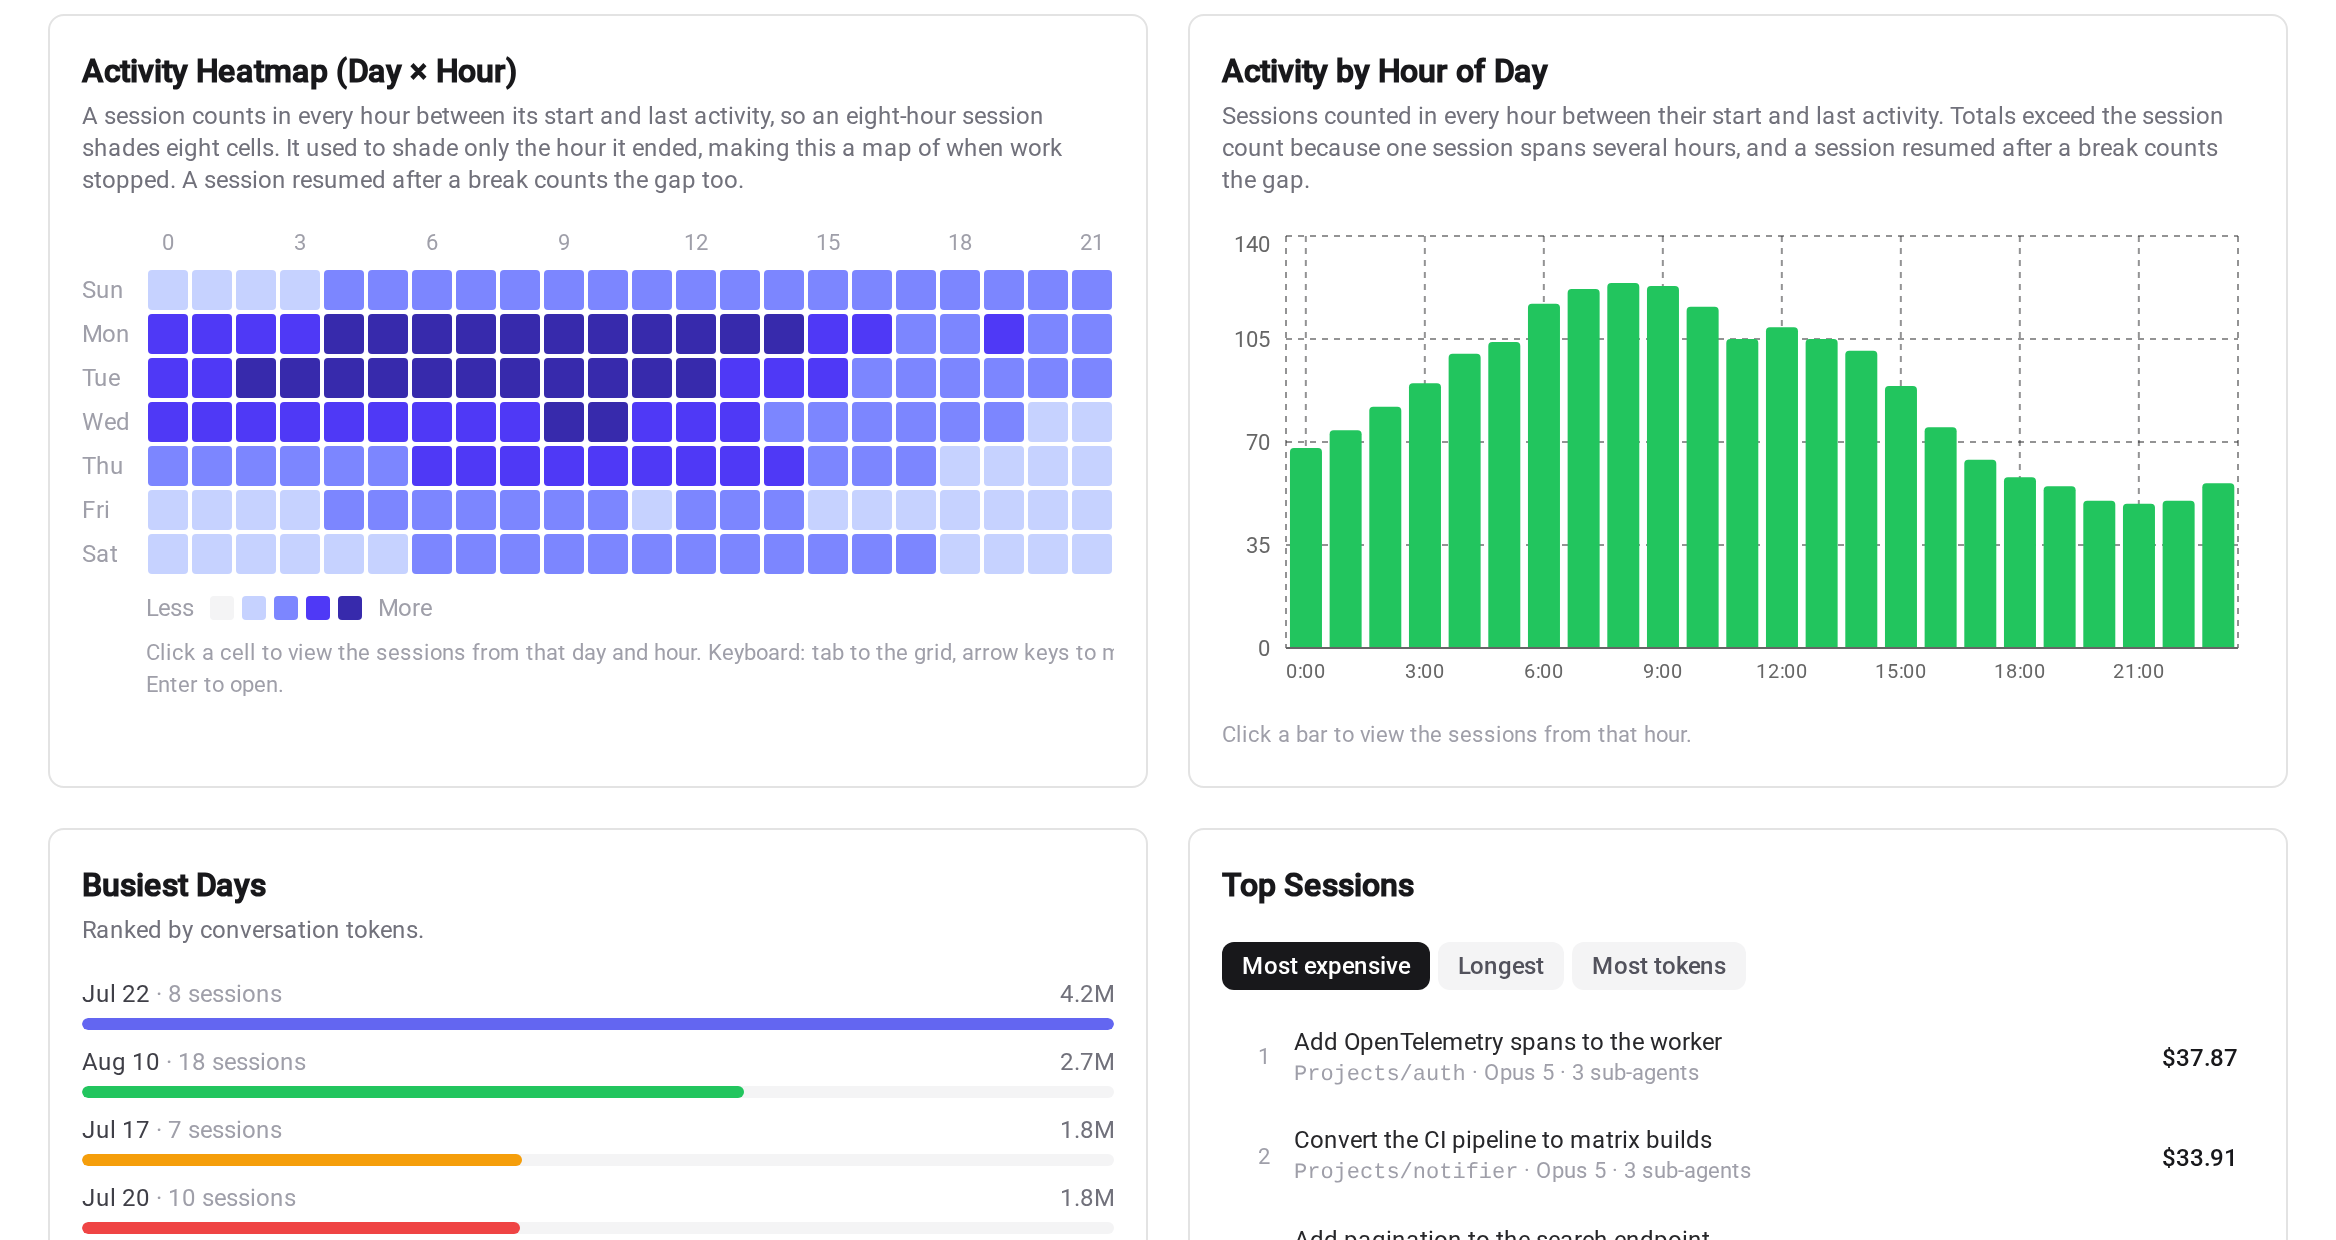 Activity by day and hour, counting sessions across every hour they were running rather than just the hour they ended
It’s an honest one, too: a session is counted in every hour between its start and its last activity, so a long run shades every hour it was alive rather than only the hour it happened to finish in. The first version of that chart shaded only the end hour, which quietly made it a map of when work stopped.
Looking at mine, the hours I get most done are not the hours I’d have named if you’d asked me.
What this actually changed
Nothing dramatic. Just a series of small, boring adjustments that compound:
- I keep sessions alive longer instead of restarting them.
- I compare models on cost, not on token volume.
- I verify that delegated work goes where I think it goes.
- I split long autonomous runs.
- I treat a rising tool-error rate as a prompt bug, not a model problem.
- I schedule the work that needs my attention into the hours the heatmap says I’m actually working.
None of that came from a benchmark or a blog post. It came from looking at my own data on a regular schedule, which is exactly the thing that’s impossible when your tool forgets everything the moment it exits.
Getting started
You need Claude Code installed and authenticated. That’s the only requirement. Agento uses your existing CLI authentication, so there’s no separate API key and no cloud account.
brew install shaharia-lab/tap/agento
agento web
On Linux or Windows, grab the binary for your platform from GitHub Releases, put it in your PATH, and run the same command. It starts on port 8990 and opens your browser.
The first scan takes a little while if you have a large history, since it’s reading every transcript in ~/.claude, and it runs in the background while you use the app, showing progress as it goes. After that it updates incrementally as new sessions appear. If there are projects you’d rather keep out of the numbers entirely, you can hide them from all reporting in Settings.
The analytics are one part of a larger tool. Agento also does agent building, scheduled tasks and integrations, which I wrote about separately. But the usage dashboards are the part I open every week without fail.
It’s MIT-licensed and free at github.com/shaharia-lab/agento. If you use Claude Code seriously, install it and go look at your last thirty days. I’d be surprised if nothing in there changes how you work.
And if it turns out to be useful, give the repo a star. It’s a small thing, and it genuinely helps other people find the project.